Definition
Influence line is defined as;
“a graph of a response function of a structure as a function of the position of a downward unit load moving across the structure”
A structure is subjected to live load or a dead load i.e. fixed load. Live load includes load of moving objects as well as that of wind load, earthquake load. One important definition of live load is the load that has change in magnitude as well as change in direction in short span of time. Dead load includes the load of structure i.e. self weight and the load of the parts that are fixed with the structure.
The best description of structure response due to dead load is bending moment diagram and shear force diagram. The bending moment diagram and shear force diagram describes variation of bending moment or of shear force across the length of the member.
Live load and influence line diagram
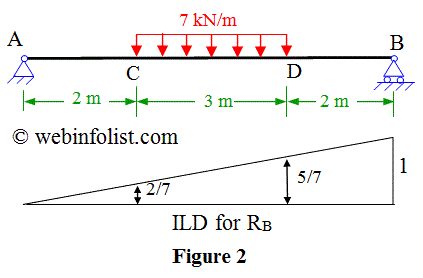
But the best description of structure response for live load is defined by influence line diagram. The influence line represents the variation of either the reaction, shear force, moment or deflection at a specific point in a member as a concentrated force that moves over the member. When the diagram is formulated one can easily determine the most critical live load position for which the structure must be designed for live load.
The ordinates of the influence-line diagram gives you the values of associated reaction, shear or moment, or deflection at the point.
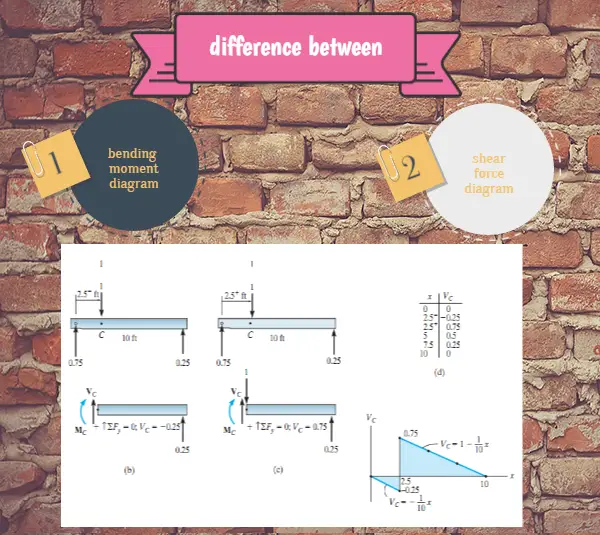
Difference between Bending Moment Diagram and Shear Force Diagram
Influence lines represent the effect of a moving load only at a specified point on a member, whereas shear and moment diagrams represent the effect of fixed loads at all points along the axis of the member
|
INFLUENCE LINE DIAGRAM
(ILD)
|
BENDING MOMENT DIAGRAM (BMD)
|
|
a) Static and Moving Load
b) Diagrams show only one point on the beam.
c) Calculations based on the virtual load.
d) Straight line only
e) Calculations do not refer to reactions of beam.
f) Unit: m
|
a) Static load only.
b) Diagram shows the moment at all points on the beam.
c) Calculations based on real loads.
d) Straight lines and curves.
e) Calculations based on the SFD.
f) Unit : kNm
|


